锂离子电池已广泛应用在智能移动设备与电动汽车等领域。目前商业化的锂离子电池正极材料受限于充放电过程中的脱锂/嵌锂机制,其能量密度能很难突破200 Wh/kg。寻找高比容量和能量密度的新一代正极材料是电池行业面临的重要挑战。此外,由于地壳中锂含量有限,电池行业的迅速发展必然带来锂离子电池生产成本的提高。因此,用含量丰富的钠和钾替代锂也是电池发展的必经之路。基于密度泛函理论(density functional theory)的第一性原理原子模拟方法可为新型电池材料的设计提供有效的指导。
近日,高飞教授(中组部千人计划特聘专家)与胡望宇教授领衔的先进能源材料模拟研究中心在《Journal of Materials Chemistry A》(JCR大类一区,IF= 8.867)上发表文章”A First-principles Investigation of ScO2 Monolayer as Cathode Material for Alkali Metal-ion Batteries”。 本文通过理论计算发现,ScO2单层纳米片做为碱金属(锂、钠或钾)离子电池的正极材料可提供不低于348 mAh/g的比容量和超过1000 Wh/kg的理论能量密度。虽然在充放电过程中ScO2纳米片会发生相变,但其仍能保持二维结构特点;此外,ScO2也不会因为在放电过程中自发生成碱金属氧化物而损失比容量。青年千人张世国教授也作为合作者参与了此项工作。
目前本文已经在线发表在http://pubs.rsc.org/en/content/articlepdf/2018/ta/c7ta10233j。本文第一作者刘智骁助理教授是我院2017年8月新引进的留美博士,第一通讯作者为先进能源材料模拟研究中心的邓辉球教授,第二通讯作者为张世国教授。
Graphic Table of Content
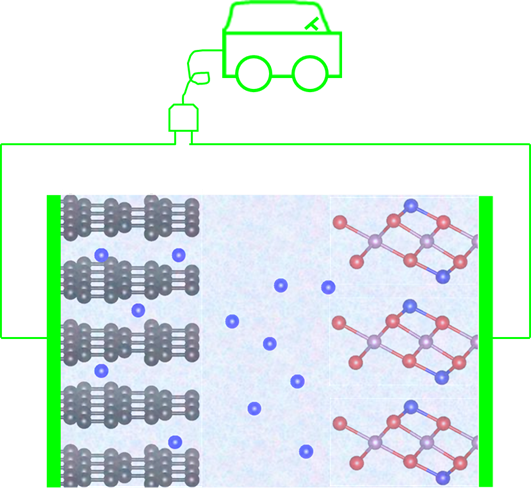
The ScO2 monolayer as the cathode material can deliver high specific capacity, voltage and energy density.
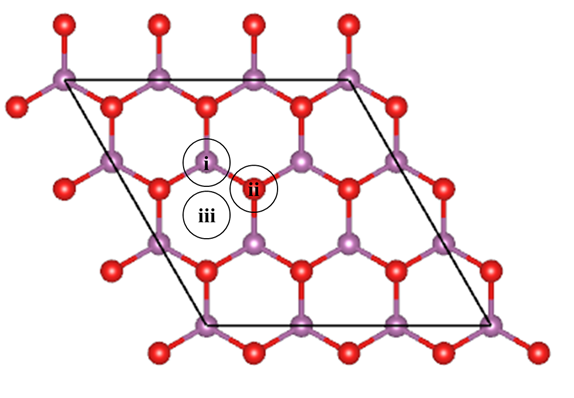
Figure 1. Top view of (
 ) H-ScO2 supercell and typical adsorption sites. The violet spheres represent Sc atoms and the red spheres represent O atoms.
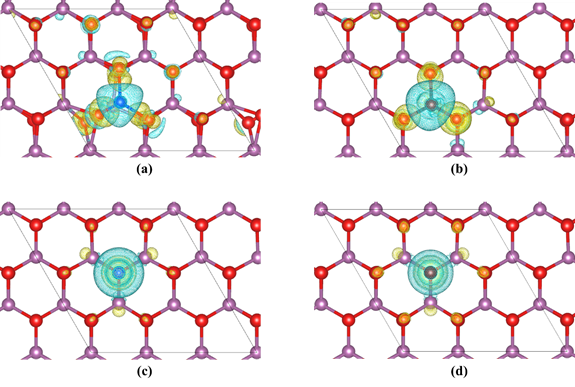
Figure 2. Difference charge density of (a) Li adsorption on the atop-Sc site, (b) Na adsorption on the atop-Sc site, (c) Li adsorption on the atop-O site and (d) Na adsorption on the atop-O site. The yellow isosurface (
 e/Å3) represents the electron accumulation region and the cyan isosurface represents the electron depletion region. The violet spheres represent Sc atoms, the red spheres represent O atoms, the blue sphere represents the Li atom, and the maroon sphere represents the Na atom.
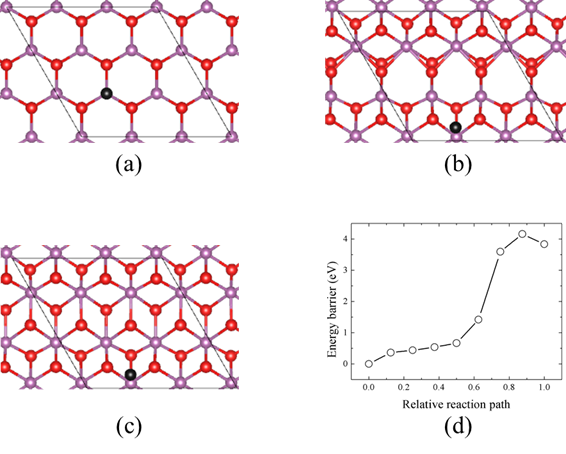
Figure 3. (a) A K atom is placed on the atop-Sc site of the (
 ) H-ScO­2. (b) The local phase transition happens after the atomistic structure optimization. H-ScO2 and T-ScO2 structures coexist in the (
 ) supercell. (c) The atomistic structure of T-ScO2 monolayer with a K atom placed on the atop-Sc site. (d) The energy barrier for the phase transition phase from the H/T phase coexistence structure to the T-ScO2 phase. The violet spheres represent Sc atoms, the red spheres represent O atoms, and the black spheres represent K atoms
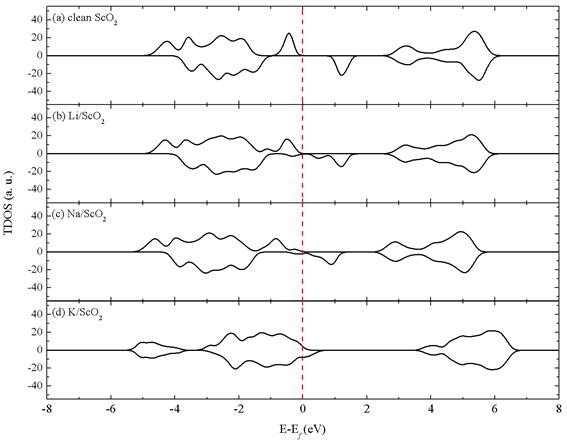
Figure 4. Total density of states (TDOS) of (a) the clean H-ScO2 monolayer, (b) Li adsorption on the atop-Sc site of the (
 ) supercell, (c) Na adsorption on the atop-Sc site of the (
 ) supercell and (d) K adsorption on the atop-Sc site of the (
 ) supercell. The vertical dash line represents the Fermi energy level. The 12
 12
12
 1 k-mesh was used for calculating density of states.
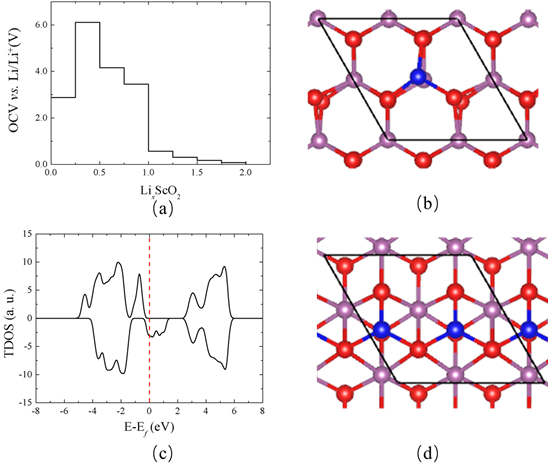
Figure 5. (a) Open circuit voltage as a function of Li content. (b) Top view of the atomistic structure of Li0.25ScO2 and (c) corresponding total density of states. (d) Top view of the atomistic structure of Li0.5­ScO2. The 18
 18
18
 1 k-mesh was used for calculating density of states.

Figure 6. (a) Open circuit voltage as a function of Na content. Top view and side view of atomistic structures of (b) Na0.25­ScO2, (c) Na0.5ScO2, (d) NaScO2 and (e) Na2ScO2.
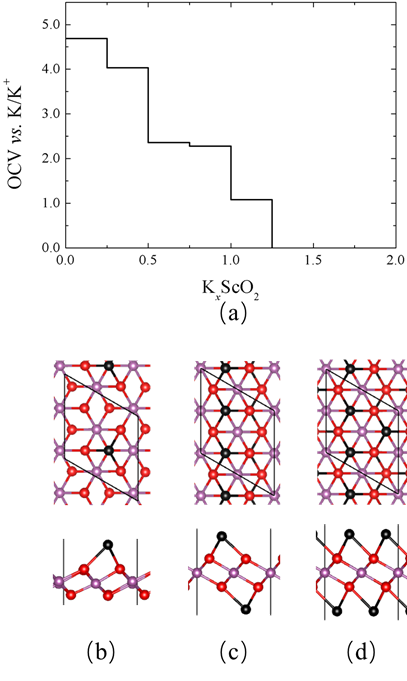
Figure 7. (a) Open circuit voltage as a function of K content in KxScO2. Top view and side view of atomistic structures of (b) K0.25ScO2, (c) KScO2 and (d) K1.5ScO2.

Figure 8. Energy barriers of Li, Na and K diffusion on the ScO2 monolayer. All calculations are conducted on the (
 ) supercell. Because K adsorption can induce H-to-T phase transition, the K diffusion barrier is calculated on the T-ScO2 substrate.

